The challenge
The agency’s leadership was focused on improving operational efficiency.
Their initial request involved mapping the processes of different business units and integrating them into Microsoft Dynamics for workflow management. This approach overlooked the nuances of the organization’s structure and the potential challenges and opportunities it presented.
My role
As an independent service design consultant, I collaborated with a team comprising two researchers, a policy owner, and a program manager.
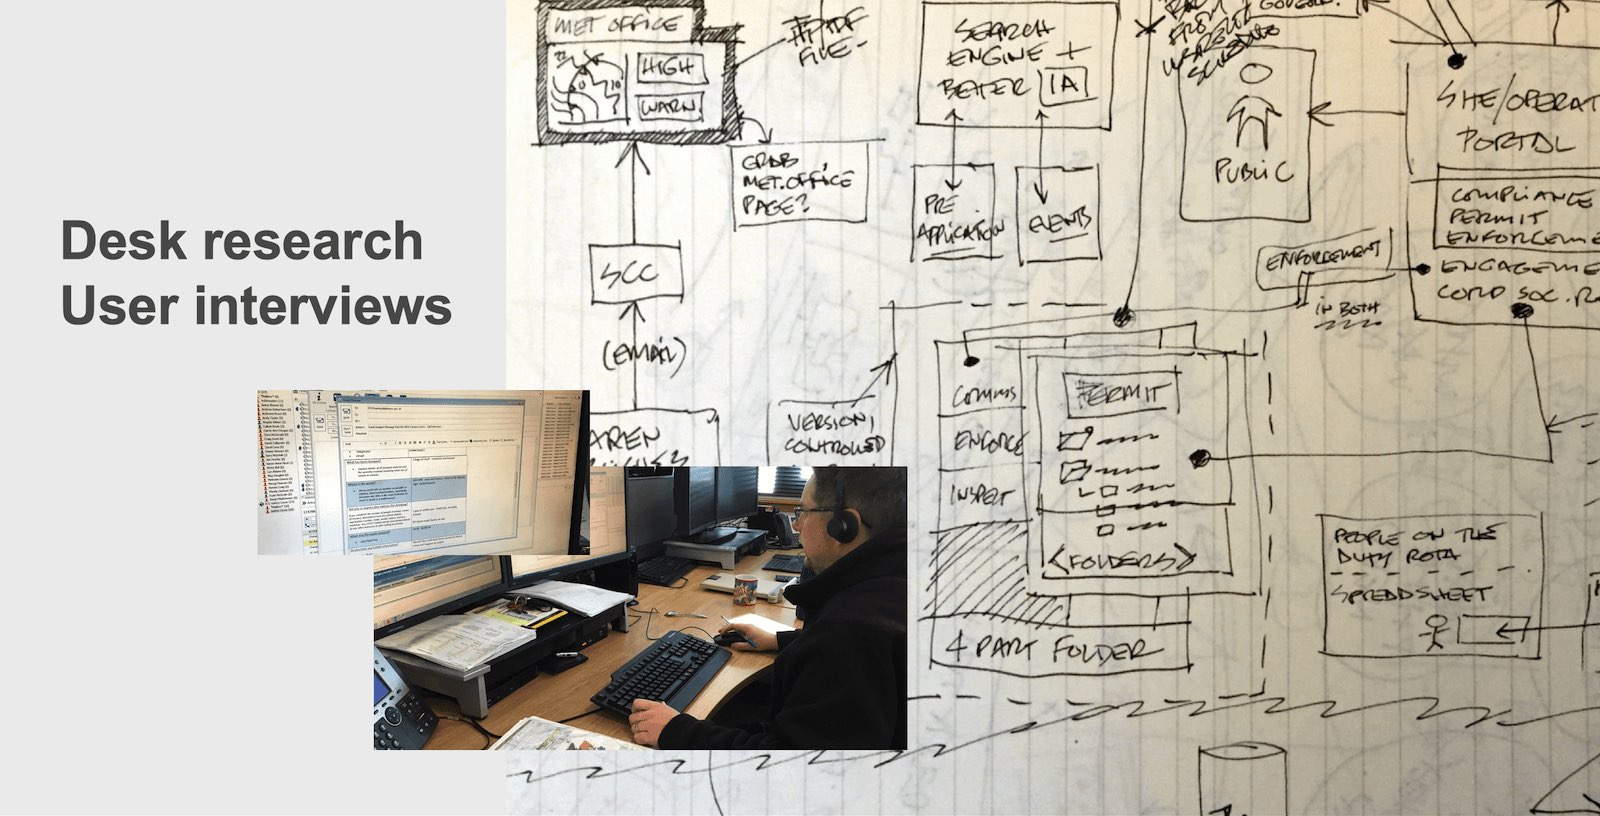
My role involved on-site work and conducting interviews with system users nationwide, following a structured discovery plan.
Initial assessment
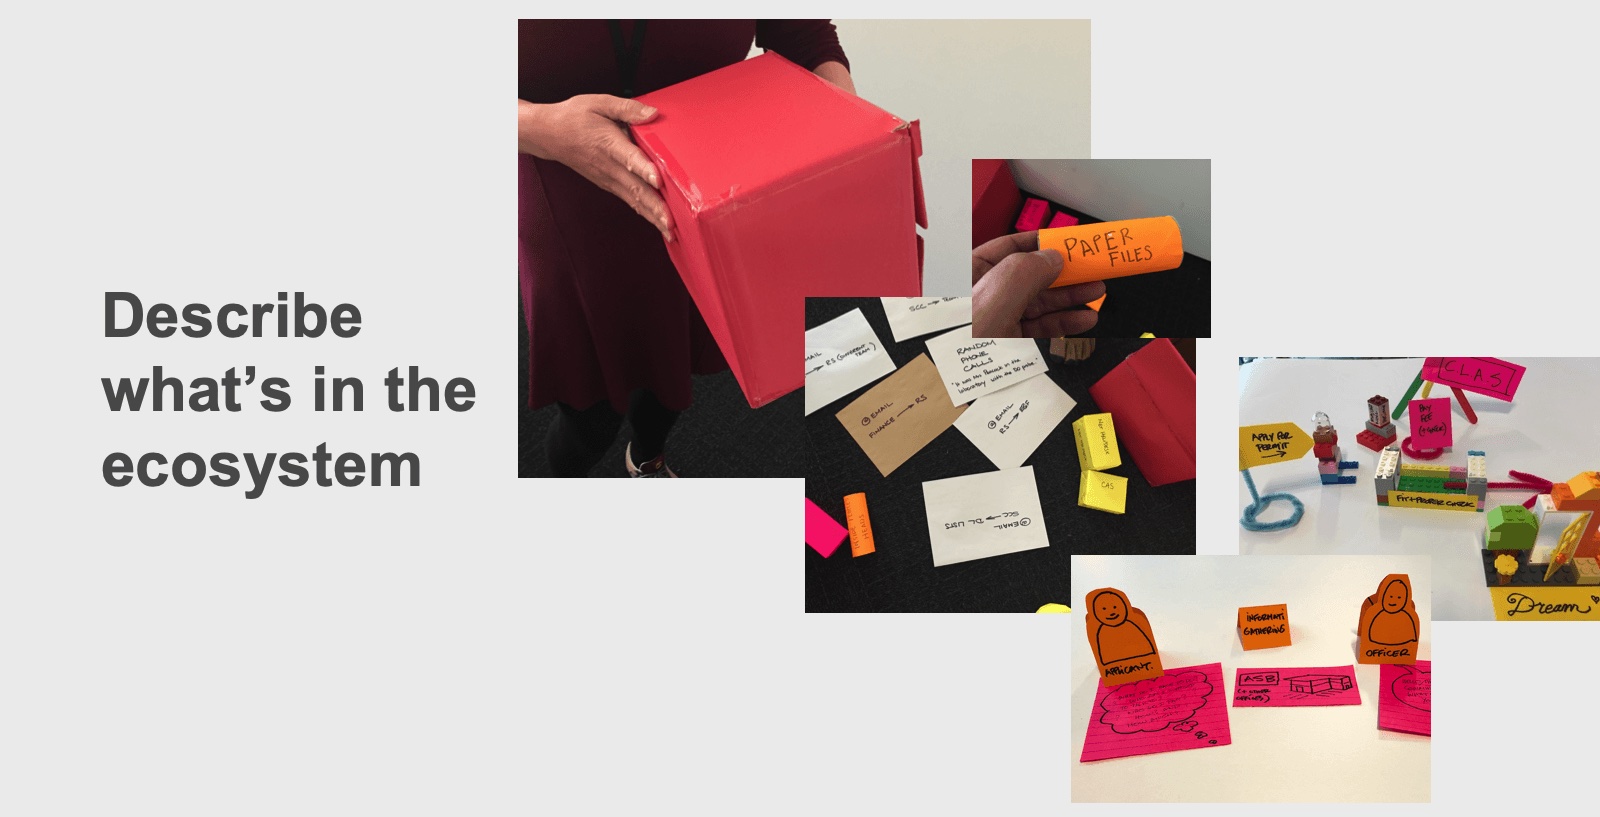
Once on-boarded to the project, I spent time understanding the agency’s ecosystem, identifying key stakeholders and actors, and comprehending their objectives. It soon became clear that a deeper dive into the user base was necessary.
This involved:
- Understanding the perspective of those being regulated
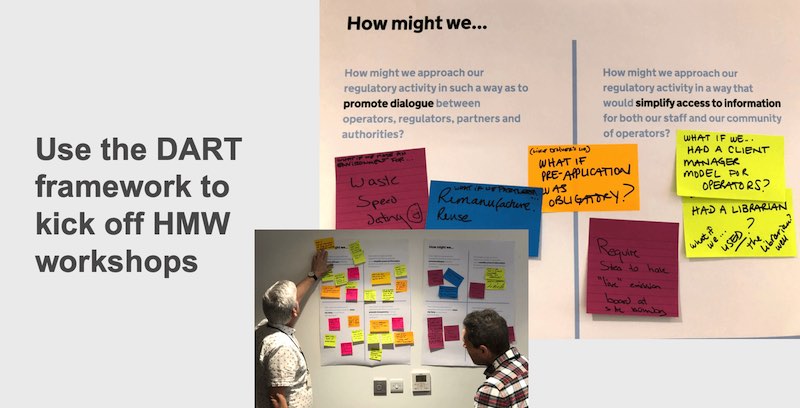
- Gaining insights from managers and officers executing regulatory tasks
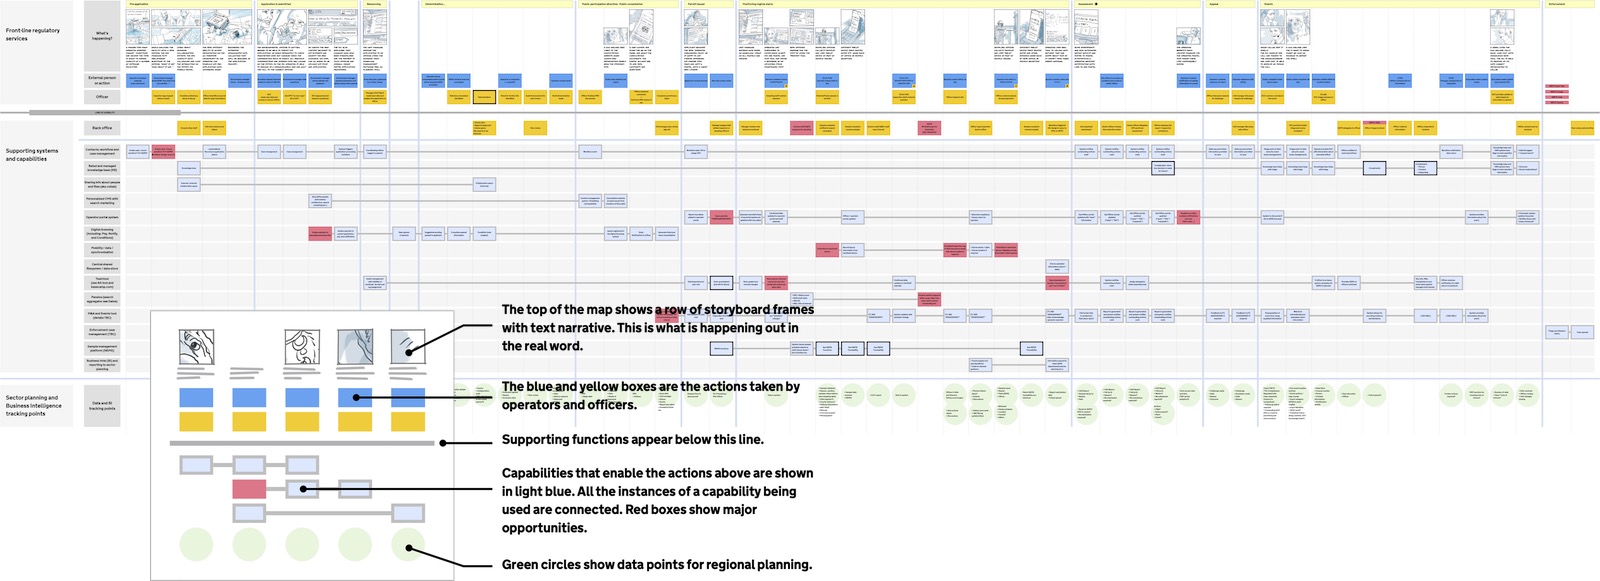
- Mapping the complete flow of regulatory activities, from registration to enforcement.
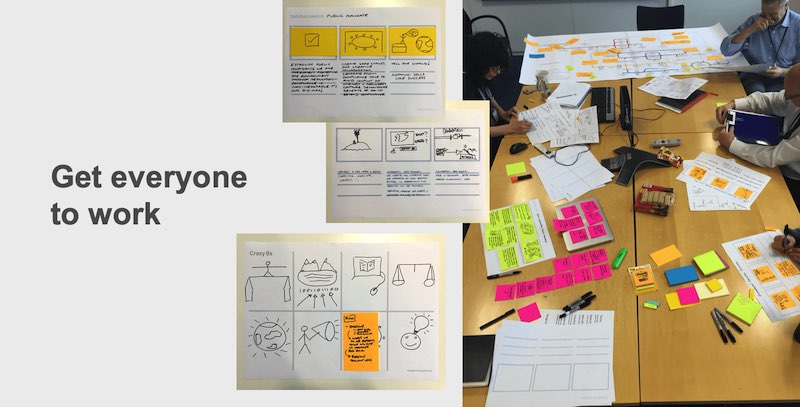
Organizational research
To gather employee feedback on actual operational procedures, I created a large “tube-map” diagram of the organization’s processes. This was displayed as a wall chart in cafeterias across the organisation’s estate, ensuring visibility to a significant portion of the workforce.
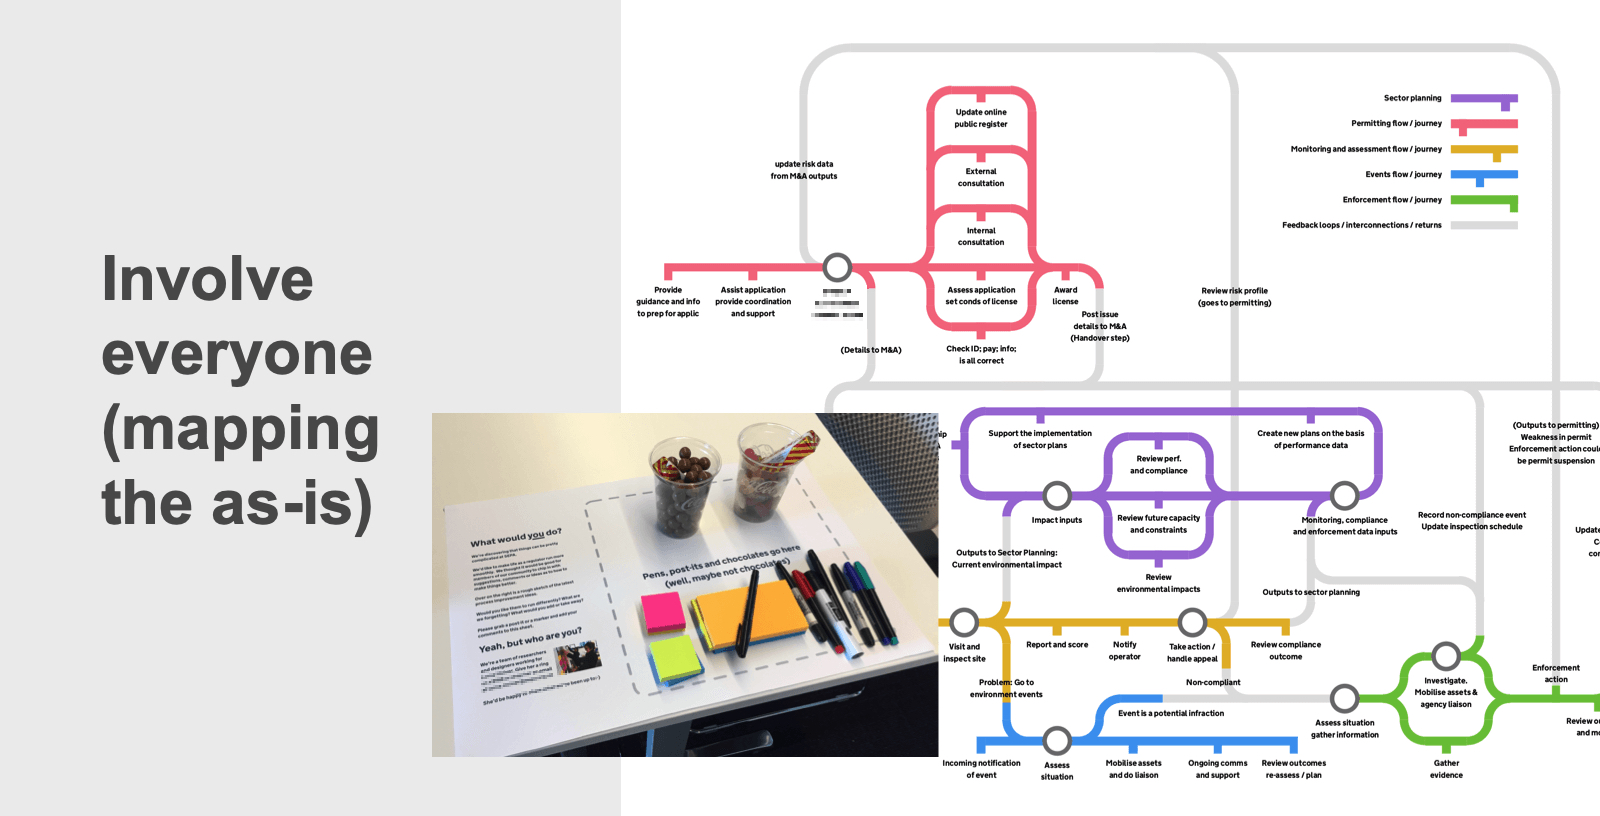
Accompanying the chart were Sharpie pens, post-it notes, a bucket of chocolates, and sweeties, with the incentive that providing feedback entitled employees to a treat.
This approach yielded a wealth of annotated maps and candid comments, contrasting management’s description of processes with the reality experienced by employees.
Analysis and recommendations
My team and I analysed the collected data, and I produced a report that challenged the initial brief of implementing Microsoft Dynamics.
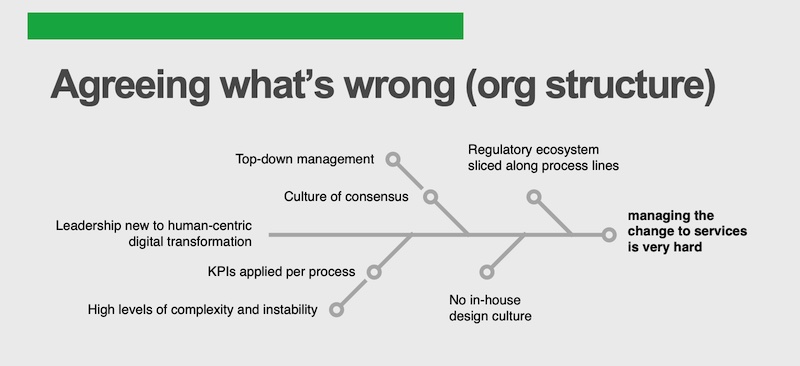
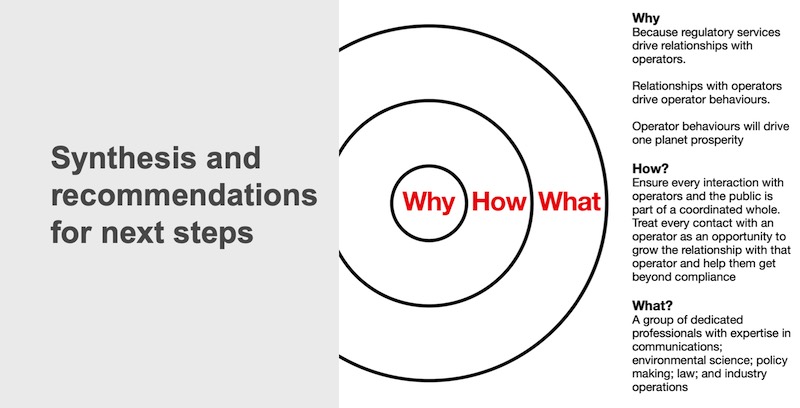
Instead, I suggested a structural review of the organization, focusing on the inefficiencies arising from the gaps between departments that, despite being independent, were functionally interdependent.
Results
My report initially surprised my primary contact in the organization, as it challenged their original plan.
However, the robustness of the research findings ultimately made it empowering for them. They called out the expression of the organisational purpose in a ‘golden circle’ as being particularly relevant, and as the report circulated among the leadership team, it gained acceptance, and my customer received commendation for the insights brought to light.
This case study underscores the importance of establishing strategic foundations with primary user research. It also demonstrates how individual design practitioners can leverage their experience to dynamically pivot processes and tools, creating entirely new tools on the fly when appropriate.
With the right leadership, bringing these design skills into organisations leads to more effective and efficient organizational strategies.
Can I help you solve a similar problem? dug@goodlookslikethis.com